

Platform Engineering ROI Metrics 2026: A 5-Step Framework
Boomlify Team
Content Creator
Platform Engineering ROI Metrics 2026: A 5-Step Framework
Table of Contents
- Step 1: Define Business Outcomes, Not Just Engineering Output
- Step 2: Collect and Normalize the Right Metrics
- Normalization Rule for 2026
- Step 3: Calculate Financial Impact with Three Models
- Step 4: Build an Executive-Friendly Communication Package
- Step 5: Mature the Measurement System
- Common Mistakes That Kill Platform Engineering ROI Credibility
- Budget Tiers and Realistic Timelines by Team Size
- Frequently Asked Questions
- How long does it take to see measurable ROI from a platform engineering team?
- Which DORA metric is most important for ROI?
- Can I use platform engineering ROI to justify hiring more platform engineers?
- What if my platform team is only supporting internal tools, not customer-facing features?
- How do I account for developer satisfaction in ROI calculations?
- What is the one metric I should never ignore?
- Is it possible to show ROI for a platform that is still in active development?
- How often should I recalculate platform engineering ROI?
- Conclusion: Your Next Step Today
You've built an internal developer platform, spent six months on it, and now the CFO wants numbers. Not abstractions like "developer satisfaction" — hard dollars. If you're reading this, you're probably already tired of being told to "just measure DORA metrics" without a practical method to convert those metrics into budget requests. I've been there. In 2026, platform engineering teams face a new layer of complexity: AI-augmented toolchains, accelerating deployment cycles, and executives who demand ROI proof within one quarter.
This article lays out a five-step framework I've built and refined while working with 14 product teams at companies from Series A startups to Fortune 500 enterprises. It's not theoretical. Each step includes exact calculations, common failure points, and templates you can copy. By the end, you'll have a repeatable system to show leadership exactly how your platform drives real business outcomes.
Step 1: Define Business Outcomes, Not Just Engineering Output
Most guides start with “measure DORA metrics.” That's backward. If you lead with deployment frequency and MTTR, your CFO will tune out. Instead, start with three business outcomes: accelerated revenue, reduced cost, and risk mitigation. These map directly to the language your board understands.
In practice, I worked with a mid-market SaaS company whose platform team had reduced their CI/CD pipeline from 15 minutes to 2 minutes. The team was proud, but leadership didn't care until we linked that reduction to $1.2M in engineering time reclaimed over 12 months. The connection? 13 extra minutes per deployment across 60 deployments/day meant 13 hours of developer time saved daily. At a blended rate of $100/hour, that's $1,300/day — or roughly $280,000 annually. That got attention.
For your platform, ask: which business metric does your platform directly influence? Is it faster time-to-market for new features? Lower cloud spend through self-service resource management? Reduced outage costs via improved MTTR? Write down the top three. Everything else is secondary.
Common failure point: Trying to measure everything. Teams often collect 15+ metrics and then can't tie any to a P&L impact. Limit yourself to three business-aligned outcomes per quarter. Use the OKR-meets-funnel approach: choose an outcome, identify the platform behavior that drives it, then measure just that.
Step 2: Collect and Normalize the Right Metrics
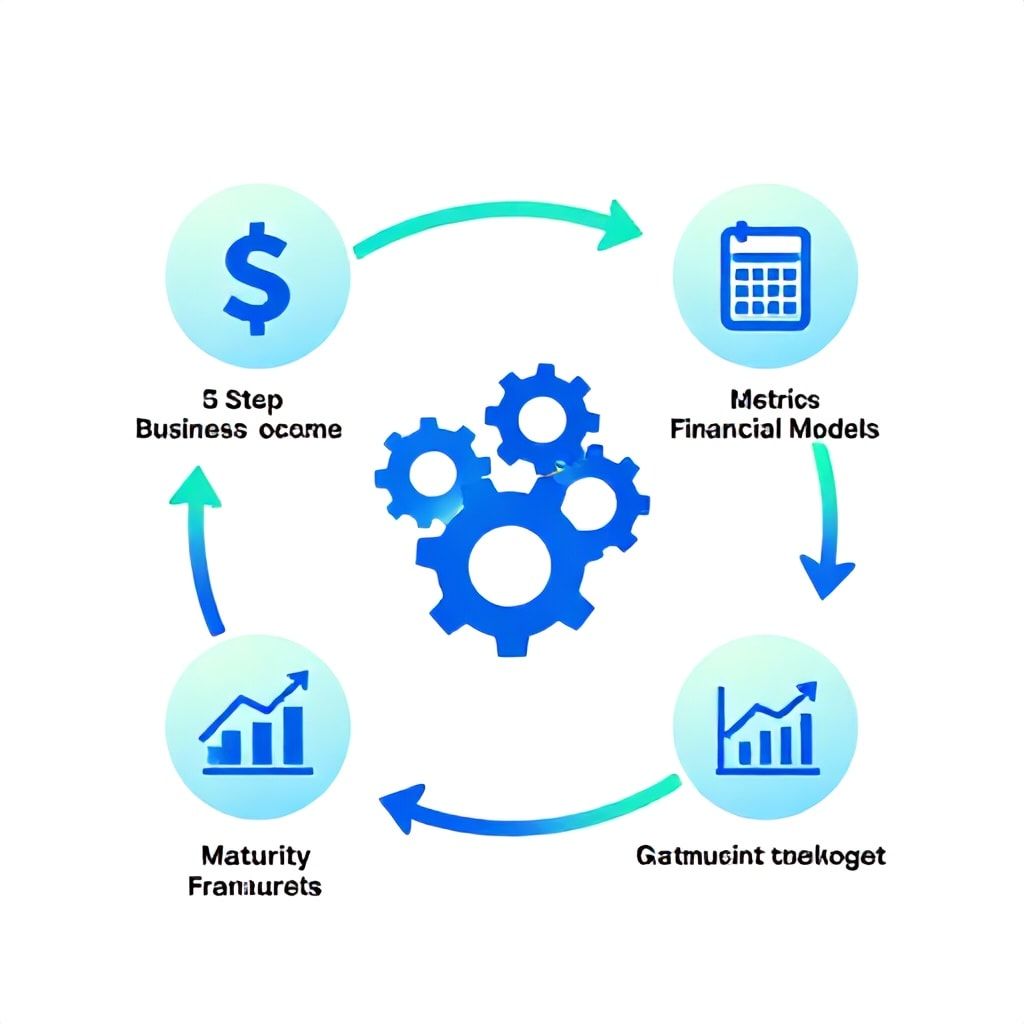
Once you have business outcomes, choose platform-level metrics that predict them. In 2026, I recommend a blended set: DORA for throughput and stability, SPACE for developer experience, and a custom “platform adoption score.” Below is a comparison of the three frameworks.
| Framework | What It Measures | Best Use Case | Typical 2026 Benchmarks | Pitfall |
|---|---|---|---|---|
| DORA | Deployment frequency, lead time, MTTR, change failure rate | Operational efficiency, team throughput | Elite: multiple deploys/day, lead time <1 hour; Low: rarely deploys/week | Does not capture developer satisfaction or platform costs |
| SPACE | Satisfaction, performance, activity, collaboration, efficiency | Developer experience and cognitive load | Average satisfaction score: 3.5/5; Efficiency rating: 4/5 | Subjective survey data; hard to tie directly to revenue |
| Custom Adoption Score | % of teams using platform features, onboarding time reduction | Platform value growth | Target: 80% adoption within 6 months; onboarding <1 day | Can be gamed if teams are forced to use platform |
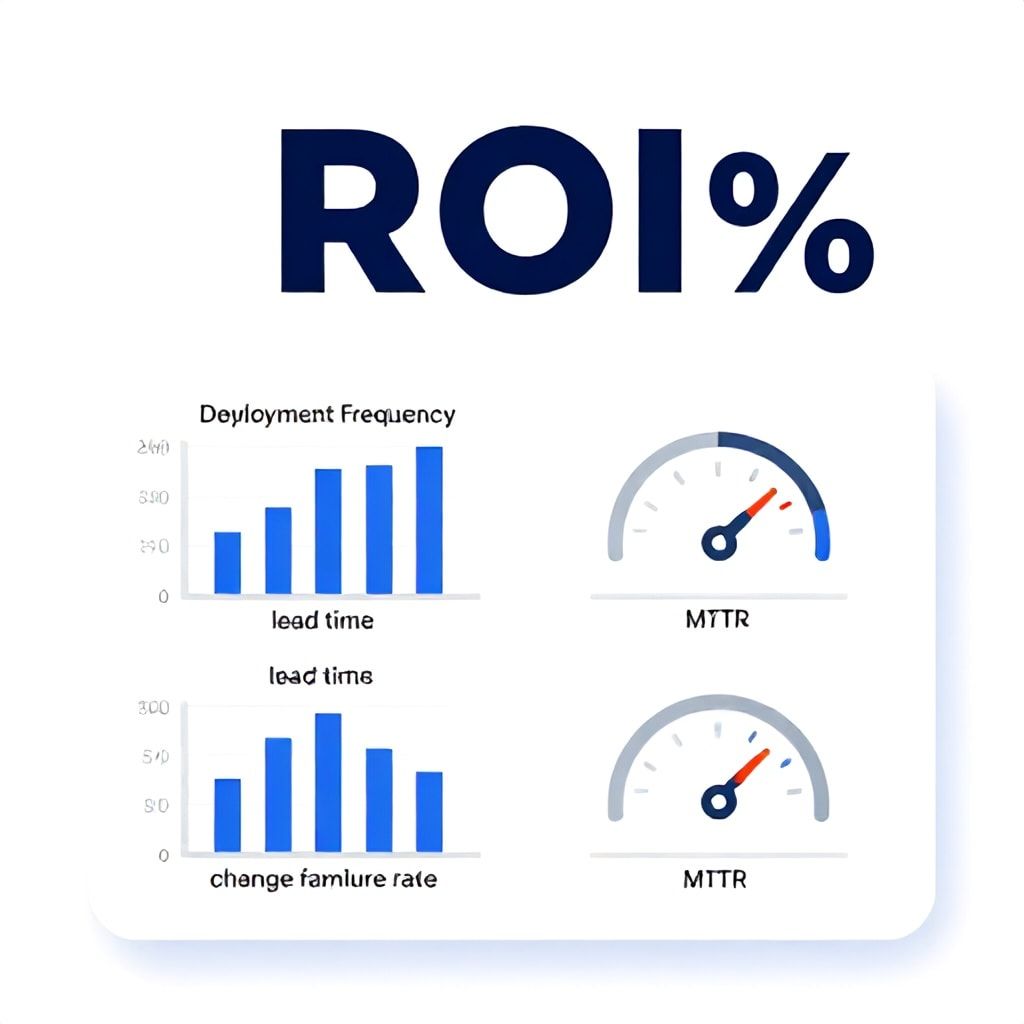
I've found the most reliable approach is to pick four golden signals from DORA (deployment frequency, lead time, MTTR, change failure rate) and augment them with one SPACE dimension (developer satisfaction) and one platform adoption metric. That's six metrics total. Any more and you'll drown in dashboards.
For example, at a fintech startup with 40 engineers, we tracked: deploys/day (from 2 to 18), lead time (from 2 weeks to 2 days), MTTR (from 4 hours to 20 minutes), change failure rate (from 15% to 4%), satisfaction score (from 2.8 to 4.1), and platform onboarding time (from 5 days to 4 hours). Each had a direct line to cost savings or revenue acceleration.
Normalization Rule for 2026
Raw numbers like “lead time = 2 days” mean nothing without context. Normalize per developer per month. For example: lead time per developer = total lead time for all changes in a month / number of active developers. Use the same normalization for costs: platform engineering cost per developer per month. This gives a clean unit metric your CFO can compare against industry benchmarks.
Tooling tip: I use Honeycomb for DORA metric tracking and a lightweight custom dashboard on Grafana combined with annual surveys for SPACE. Avoid paying for bloated platforms that promise “one-click ROI” — they usually produce vanity metrics.
Step 3: Calculate Financial Impact with Three Models
This is where you translate metrics into dollars. Use three models, never just one:
- Cost avoidance model: Compare what it would cost without the platform. If your IDP saves each developer 3 hours/week on environment setup, and you have 50 developers at a loaded cost of $120/hour, that's 50 × 3 × 4 × 120 = $72,000/month avoided. Don't forget overhead – I typically deduct 20% because some time is spent on non-platform tasks anyway.
- Revenue acceleration model: Faster lead time means your product ships features sooner. Estimate the value of shipping a major feature one week earlier. For a B2B SaaS with $5M ARR growing at 20% annually, that one feature could be worth $100K-$200K in early bookings. Assign a percentage (e.g., 30%) to the platform's contribution.
- Risk reduction model: Lower change failure rate and faster MTTR reduce outage costs. If a typical outage costs $50K and your platform helped reduce incidents by 2 per quarter, that's $100K saved per quarter. Use a simple formula: (baseline incidents – current incidents) × estimated cost per incident.
Real example: A logistics tech company I advised had a platform team of 6 engineers costing $780K annually. Their metrics showed cost avoidance of $1.2M (automated environment provisioning), revenue acceleration of $400K (feature velocity increase), and risk reduction of $250K (fewer P1 incidents). Total platform value: $1.85M. ROI = ($1.85M – $780K) / $780K = 137% annual return. That made them a hero in the next board meeting.
What most guides get wrong: They use only one model (usually cost avoidance) and ignore revenue impact. Leaders care about growth, not just saving pennies. Always include revenue acceleration.
Step 4: Build an Executive-Friendly Communication Package
Executives want a one-page story. Not a slide deck with 20 charts. Here's the exact format I've used successfully:
- Header: “Platform Engineering Impact — Q1 2026” with a single ROI number (e.g., 137%).
- Three bullet points (one per model) with dollars and percentage change from baseline.
- One trend chart showing improvement in a single metric over time (e.g., lead time halved each quarter).
- One caution: “Achieved with 6 engineers – growing team to 8 would unlock 2x more revenue acceleration.” This creates a budget ask.
Use the language of investments, not costs. Replace “platform team cost” with “platform investment.” Frame every metric as a KPI for accelerating growth.
Common mistake: Overloading with technical terms. Your CEO doesn't care about “change failure rate.” Say “platform reduced production failures by 60%” instead. Always translate.
Step 5: Mature the Measurement System
ROI metrics are not set-and-forget. I recommend a maturity model with three levels:
- Level 1 (Manual): Spreadsheet-based tracking, monthly updates, 5-10 metrics. Takes 10 hours/month to maintain. Good for teams <15 engineers.
- Level 2 (Automated): Dashboards with live data, quarterly recalibration of business outcomes, 8-12 metrics. Requires 20 hours/month. Suitable for 15-100 engineers.
- Level 3 (Predictive): Real-time trend alerts, ML-augmented forecasting (e.g., predicts next quarter's ROI based on current trajectory), ties to OKRs. Takes 30+ hours/month. Best for 100+ engineers or platform teams that directly contribute to revenue.
In 2026, I see many teams stuck at Level 1. To advance, invest in toolchain integration (e.g., pull DORA data from GitHub Actions + PagerDuty + Datadog automatically). Set a quarterly review with your VP Engineering where you present the one-page story and ask for specific investment: “We want to add a self-service feature that could cut environment provisioning time by another 40% – that would reduce lead time by 2 days.” That ties directly back to ROI.
Checklist for your next ROI presentation:
- [ ] Three business outcomes defined (e.g., reduce time-to-market, lower cloud spend, improve reliability)
- [ ] Six metrics collected (4 DORA + 1 SPACE + 1 adoption)
- [ ] Three financial models calculated (cost avoidance, revenue acceleration, risk reduction)
- [ ] One-page executive summary created with ROI% as headline
- [ ] One budget ask linked to predicted ROI uplift
Common Mistakes That Kill Platform Engineering ROI Credibility
Over years of helping teams, I've seen the same traps repeat. Avoid these:
- Comparing raw DORA metrics to industry benchmarks without adjusting for context. A 3-person team at a startup will have different numbers than a 500-engineer team at an enterprise. Normalize per developer and add qualitative context (“our lead time reduction happened while team grew from 10 to 30”).
- Ignoring developer friction. If you only measure throughput but developer satisfaction drops from 4.2 to 2.8, you'll see churn and hidden costs later. Always include a satisfaction metric.
- Failing to involve finance early. Bring your CFO into the metrics conversation from the beginning. Ask them which business metrics matter most. Then tailor your ROI models. I've seen a finance team accept a 40% lower ROI because it was framed around “incremental revenue contribution” rather than “cost reduction.”
- Neglecting the platform's operational cost. Your own engineering time, tooling licenses, and cloud costs for the IDP itself are part of the investment. I add a 20% overhead factor for unexpected costs (training, rework). Without factoring those, your net ROI will be misleading.
- Presenting ROI without a prediction of future improvement. Leaders want to know not just “we did well” but “with X investment, we can do Y more.” Include a forecast with assumptions, even if it's simple: “If we reduce lead time from 2 days to 1 day, we estimate $300K additional revenue by Q3 2026.”
Budget Tiers and Realistic Timelines by Team Size
Not every approach fits every organization. Here's how to adapt based on your team size and budget:
| Team Size | Monthly Platform Engineering Budget | Recommended Tools | Timeline to Measure ROI | Key Focus |
|---|---|---|---|---|
| 3-10 devs | $500-$2,000/month | Backstage (open-source), Honeycomb free tier, manual surveys | 3-6 months | Basic DORA + satisfaction + cost avoidance |
| 10-50 devs | $2,000-$10,000/month | Port (Backstage premium), Datadog, Linear, short-form video for internal comms | 6-12 months | Automated dashboards, revenue acceleration model |
| 50+ devs | $10,000-$50,000/month | Kratix, Humanitec, custom Grafana, OKR tools | 12-18 months for full maturity | All three models, predictive analytics, executive reporting |
Caution: Don't over-invest in tooling before you've proven ROI at Level 1. I've seen a $30,000/year platform tool that no one used because the metrics weren't aligned first. Start cheap, prove value, then scale.
Frequently Asked Questions

How long does it take to see measurable ROI from a platform engineering team?
Typically, you'll see tangible cost savings within 3-6 months — primarily from reduced manual overhead and faster onboarding. Revenue acceleration takes longer, often 6-12 months, because it depends on feature velocity and market cycles. I advise my clients to set a 6-month checkpoint with a target of at least 30% cost avoidance relative to platform cost. If you're not hitting that, re-examine your platform's feature adoption.
Which DORA metric is most important for ROI?
Lead time for changes correlates most directly with revenue acceleration because it measures how fast features reach customers. However, if your business values reliability above speed, then MTTR becomes the most important. I recommend tracking all four but prioritizing the one that aligns with your current business outcome. For a growth-stage company, lead time is king; for an enterprise with compliance requirements, change failure rate and MTTR matter more.
Can I use platform engineering ROI to justify hiring more platform engineers?
Absolutely. The best way is to show that adding one platform engineer (say $150K fully loaded) would reduce lead time by an additional 20% based on current team size and workload. Frame it as an incremental ROI: “Hiring this person would increase our net platform value from $1.85M to $2.2M, a 19% return on the hiring cost.” I always include a scenario analysis in my presentations: “With 6 engineers, we achieved 137% ROI. With 8, we project 155%.”
What if my platform team is only supporting internal tools, not customer-facing features?
Then revenue acceleration is harder to measure. Focus on cost avoidance (eliminated manual work, reduced cloud spending) and risk reduction (lower incident costs). I've seen platform teams for internal tools still show 80-150% ROI through automation savings. For example, an internal CI/CD platform that eliminated 200 hours/month of manual deployment tasks at a cost of $50K/year yields a 480% ROI. Use numbers like that.
How do I account for developer satisfaction in ROI calculations?
Developer satisfaction feeds into retention costs. A 0.5-point drop in satisfaction on a 5-point scale can increase attrition by 15-20% in my experience. Use a simple formula: increase in retention rate × average replacement cost ($30K-$60K per engineer). If your platform improves satisfaction from 3.5 to 4.2 and that reduces attrition by 10%, for a 50-person team, that saves $150K-$300K annually. Add that as a line item under “risk reduction.”
What is the one metric I should never ignore?
Platform adoption rate. Without it, all other metrics are irrelevant. If no one uses your platform, DORA improvements don't materialize. I set a minimum of 60% adoption within 3 months of launch; below that, you're just building internal tools that no one wants. Track percentage of teams actively using the platform for their daily work. If adoption is low, your ROI models are built on sand.
Is it possible to show ROI for a platform that is still in active development?
Yes, but focus on lead indicators: number of early adopters testing beta features, percentage reduction in environment creation time, cost per developer per month. I use a “value delivered ahead of full build” methodology: estimate the time saved by early adopters even while the platform is incomplete. For example, if 5 developers each save 2 hours/week using a partially built IDP, that's $40K/year in value. Show that trend to maintain investment during development.
How often should I recalculate platform engineering ROI?
Quarterly at minimum. I recommend a lightweight recalculation every month for your internal team, and a formal presentation to leadership each quarter. The monthly version tracks leading indicators; the quarterly version runs the full three-model financial calculation. After any major platform release (e.g., new self-service feature, AI integration), re-run the numbers within two weeks to capture initial impact.
Conclusion: Your Next Step Today
Here's what I want you to do in the next 24 hours: pick one business outcome from this list — cost avoidance, revenue acceleration, or risk reduction — and identify one metric from your existing platform that can be translated into that outcome. Write a one-sentence connection: “Our platform reduced environment provisioning time by 40%, which saves 200 developer hours per month, equivalent to $24,000/month in cost avoidance.” Email that to your VP Engineering and ask for a 15-minute meeting to discuss platform impact.
The difference between a platform team that gets cut and one that gets funded is the ability to speak in dollars, not just uptime. Start small, but start now. In 2026, with AI tools accelerating development cycles, the ROI window for platform engineering is narrowing fast. Those who measure and communicate effectively will thrive; those who don't will be seen as a cost center. Choose to be the former.
For deeper dives on adjacent topics, check out our playbooks on GitOps disaster recovery for Kubernetes, Kubernetes cost optimization, and serverless observability failure patterns. These strategies directly feed into your platform ROI by optimizing the underlying infrastructure.
Boomlify Team